Perhaps the most difficult forecast any meteorologist has to issue is a Terminal Aerodrome Forecast or TAF. They are the most detailed aviation forecast made available to pilots and they will be around for a long time to come. The terminal area is quite small; it is officially defined as “the area within five statute miles of the center of an airport’s runway complex.” Do you remember the world globe you used in grade school? Well, imagine placing a single dot on that globe with a sharp pencil – that’s about the size of the terminal area. Consequently, forecasters consider a TAF a point forecast.
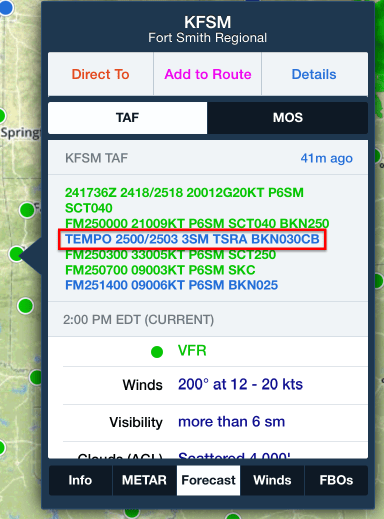
Let’s take a look at a specific example. Below is a TAF for the Fort Smith Regional Airport (KFSM) issued at 1736 UTC – well before any thunderstorms had formed. Notice the forecaster believes that moderate rain and thunderstorms will temporarily impact the Fort Smith terminal area between 0000 and 0300 UTC (8 p.m. to 11 p.m. EDT).
 If you had also looked at the automated ForeFlight MOS forecast below within a similar timeframe, you would have seen a much different forecast. In fact, MOS did not forecast any thunderstorms or precipitation from 1900 to 0200 UTC (3 p.m. to 10 p.m. EDT). Instead, MOS predicted some gusty southwest winds with good visibility and a high scattered cloud deck. Which one provides the best guidance?
Actually, both! As it turned out thunderstorms did roll through the terminal area as predicted by the TAF a little bit after 0000 UTC as shown in the METARs below. However, the total amount of precipitation measured in the Fort Smith rain bucket for the event was a meager 3/100 of an inch. So the primary thunderstorm cell passed through the northern edge of the terminal area with the sun low in the horizon beaming in from the west (notice CLR skies were also reported).
KFSM 250353Z 28005KT 10SM CLR 18/14 A2992 RMK AO2 SLP127

KFSM 250253Z 27007KT 10SM CLR 19/15 A2990 RMK AO2 SLP122

KFSM 250153Z 26010KT 10SM SCT050 22/15 A2986 RMK AO2 RAE19 TSE33 P0003

KFSM 250139Z 28008KT 10SM FEW038 BKN050 21/16 A2986 RMK AO2 RAE19 TSE33 P0003

KFSM 250053Z 21012KT 10SM -TSRA CLR 24/14 A2982 RMK AO2 RAB49 TSB02 SLP093 LTG ICCC P0000

KFSM 250008Z 21013KT 10SM TS CLR 26/13 A2980 RMK AO2 TSB02 LTG ICCC

KFSM 242353Z 21016G21KT 10SM CLR 26/13 A2979 RMK AO2

KFSM 242253Z 22019G26KT 10SM BKN065 27/12 A2979 RMK AO2
Fort Smith was on the southern-most edge of a fairly broken line of thunderstorms as shown on the ForeFlight Map view below. This line of storms quickly moved in from the west along and ahead of a surface cold front. As you can see below, there was one small cell that moved through the Fort Smith terminal area approximated by the small red circle. It’s this cell that triggered the thunderstorm observation at 0008 UTC.
So it’s easy to see that Fort Smith could have been in that large gap to the northeast creating a situation more representative of the automated MOS forecast. The forecaster that issued the TAF took a little meteorological risk and felt there was a fairly reasonable chance this line of thunder would evolve and impact the Fort Smith terminal area; a gutsy move given how this broken line of storms ultimately evolved.
MOS, on the other hand, wasn’t as certain about the possibility of thunderstorms passing through the terminal area; it was leaning towards a forecast more representative of the weather within the gap. This is a good example of the “edge effect” that happens quite often when issuing such a point forecast whether it is issued by a meteorologist or automated tool. Ten miles can make a huge difference in making a good forecast or getting it wrong.

