Lowest Tilt radar can be an important tool for pilots, providing a clearer picture of weather conditions at lower altitudes. We asked KOKI-TV Chief Meteorologist James Aydelott – a longtime ForeFlight user and instrument-rated pilot – to weigh in on the benefits and differences of lowest tilt radar from other radar layers.
Weather radar can be complicated, even for a meteorologist. For both the VFR and IFR pilot, there are a lot of different weather radar products to choose from. Now that ForeFlight has brought lowest tilt radar back into the app, it begs the question:
Which radar data is better for a pilot to use?
A) Radar (Composite)
B) Radar (Lowest Tilt)
C) Both A and B
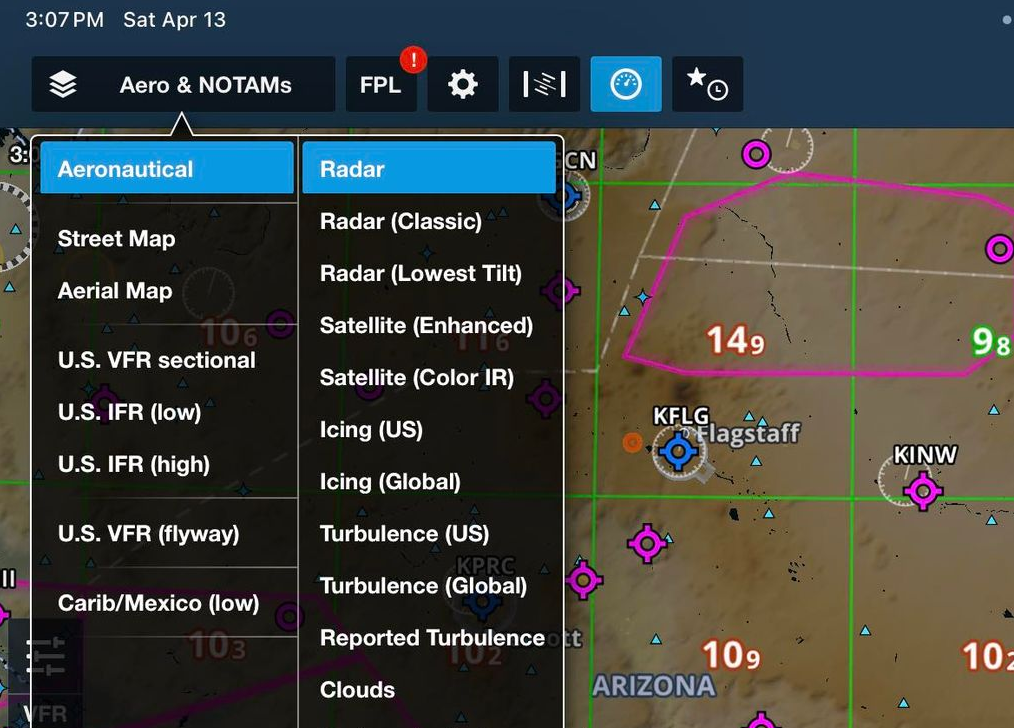
Figure 1
I’m sure many ForeFlight users are wondering what the difference is, what the strengths and weaknesses are of each, and when pilots should use one over the other.
First, a quick introduction: I’ve been an instrument-rated private pilot since 1999, and own a Cessna Cardinal. I’ve been the Chief Meteorologist at KOKI-TV in Tulsa since 2009.

My degree in meteorology is from the University of Oklahoma, and I’m currently an Emergency Management PhD student at Oklahoma State University. My main professional interest is the real-time use of Doppler radar in communicating severe weather warnings, and academically, my emphasis is on individual risk perception during severe weather, and increasing the effectiveness of severe weather warnings. But that’s more than enough about me.
Let’s go over some weather radar background. In the United States, a network of weather radars, NEXRAD, is operated by the National Weather Service, the Federal Aviation Administration, and the Department of Defense. These agencies use the data to issue weather warnings, aviation weather, and short-term forecasting. Data from the NEXRAD network is also distributed to various private companies for distribution. These radars operate by performing a volume coverage pattern (VCP) to build a three-dimensional view of the atmosphere. There are several VCP scan strategies available to use, but all feature the same basic approach: each radar site builds a 3D view by completing a series of full 360° sweeps at various radar antenna tilts.
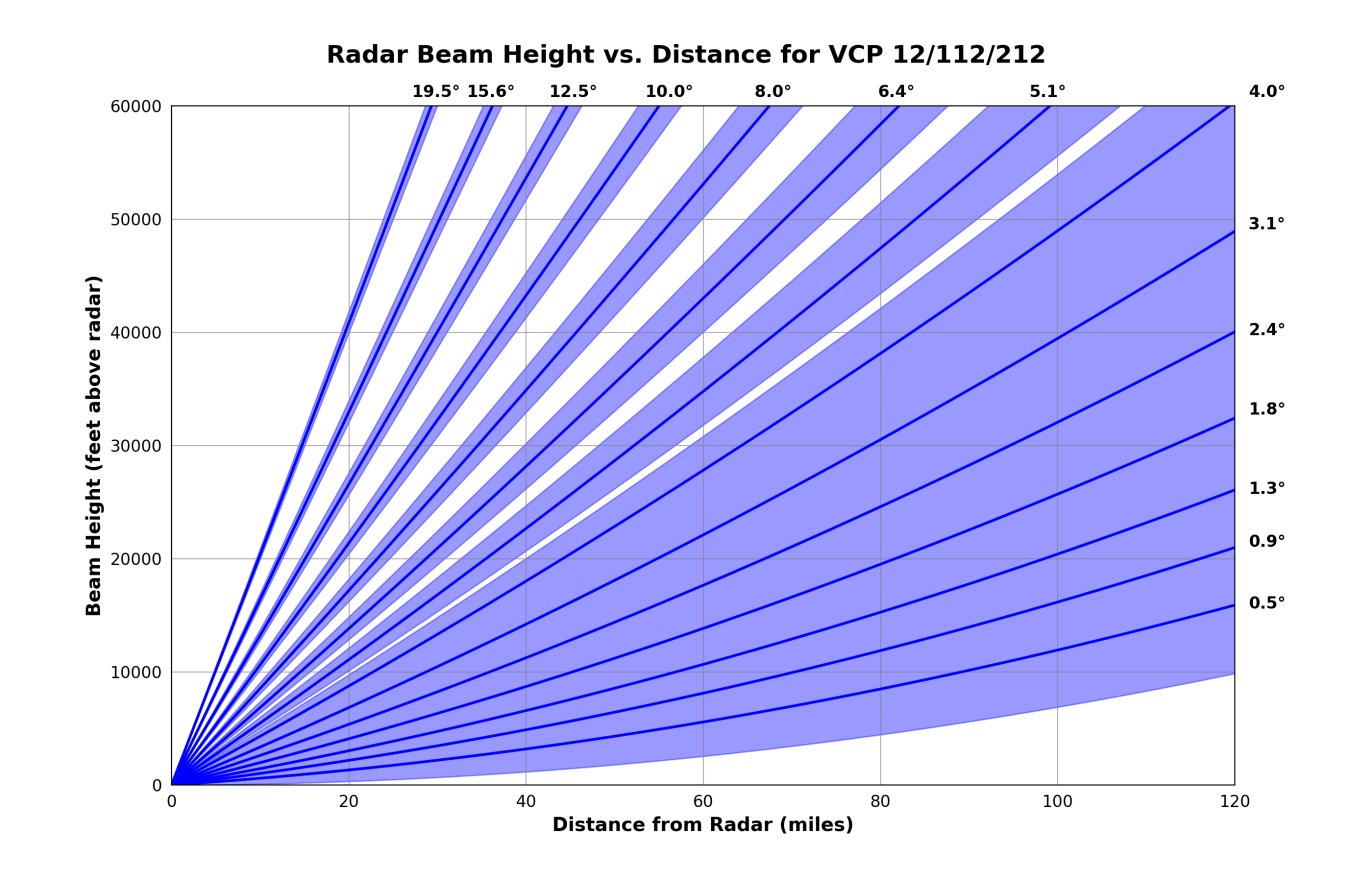
Figure 2
While the radar collects far more than reflectivity data, for our discussion, we’ll largely stick to reflectivity – the type of radar image we’re all familiar with – which displays the strength of the returned radar pulse. The more reflective the precipitation is, the stronger the returned power of the radar pulse is. Higher rates of precipitation are usually more dense and reflect more radar energy back to the radar. Wet hail and melting snow are incredibly effective radar energy reflectors, which is why they usually show up as a strong radar return.
As far as the two radar products go: lowest tilt is fairly self-explanatory, it is the data (usually) collected on the sweep with the radar antenna tilted at 0.5° above the ground (a handful of radars are fractionally lower). The composite radar product is completed at the end of a volume scan, and displays the highest radar return over a spot from any of the vertical tilts of data, but it is important to note: the composite product doesn’t display what altitude that highest radar return comes from, it could be from the base tilt a few thousand feet above ground, or an upper tilt, tens of thousands of feet above ground. Think of each 360° flat sweep from each elevation of the radar, plotted on graph paper, and stacked on top of each other. The highest reflectivity on a square – regardless of height – gets assigned to that square on the graph paper.
A national-scale mosaic is built from both of these products every five minutes. Obvious spots of “false echoes” like large-scale temperature inversions, and ground reflections are removed from the mosaics. These removal algorithms tend to work really well, but sometimes they struggle. An algorithm attempting to determine the state of the precipitation, liquid (rain), snow, or ice is also used when generating the mosaic. The algorithm assigns an appropriate color to each precipitation type: liquid ranges from green to red, snow appears as shades of blue, and ice appears as shades of magenta. The algorithms to determine precipitation type are different, and can occasionally conflict as shown in figures 3 and 4.
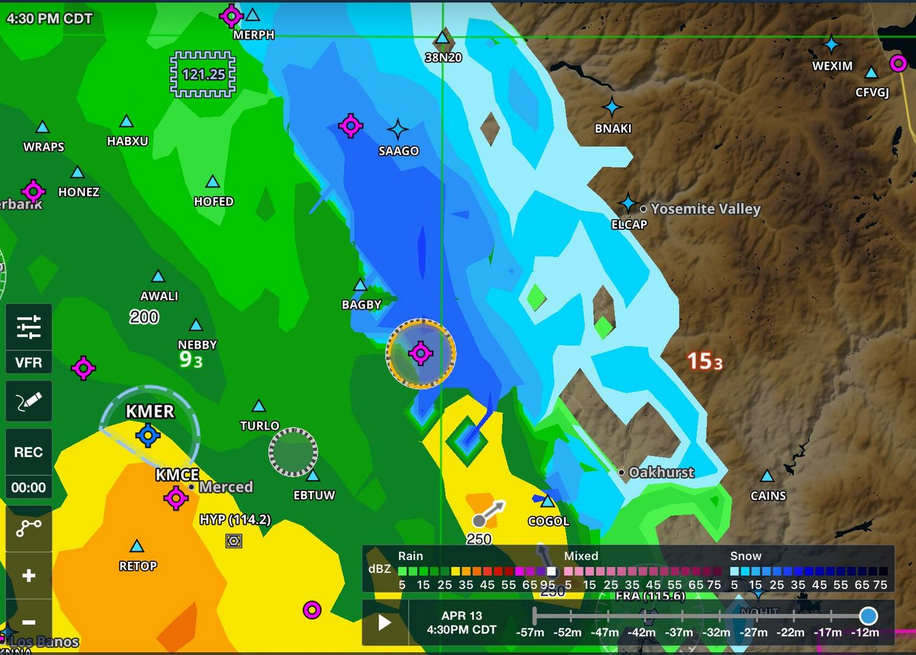
Figure 3 – Composite radar
Figure 4 – Lowest tilt radar
Timing is another difference between the two radar products. The lowest tilt data can be used to build the mosaic as soon as the tilt is complete and sent to the radar distributor, then to your phone or tablet. The composite product has to wait until the radar site finishes its volume scan, then sends to the radar distributor. This usually introduces a delay of five to ten minutes in the composite product compared to the lowest tilt product. It is important to note, though, cockpit radar data feeds should not be used to time safety margins to a five- or ten-minute window.
Composite radar may depict moisture and icing in flight level flying better, especially in a thunderstorm environment, since reflectivity of ice or supercooled water may be over a spot with lower or no reflectivity in the lowest tilt radar data.
Terrain can also generate a difference. In some parts of the country, mountains may block the lowest tilt radar product, and show little or no precipitation. In this case, composite radar may show a more representative depiction of actual precipitation as shown in figures 5 and 6.
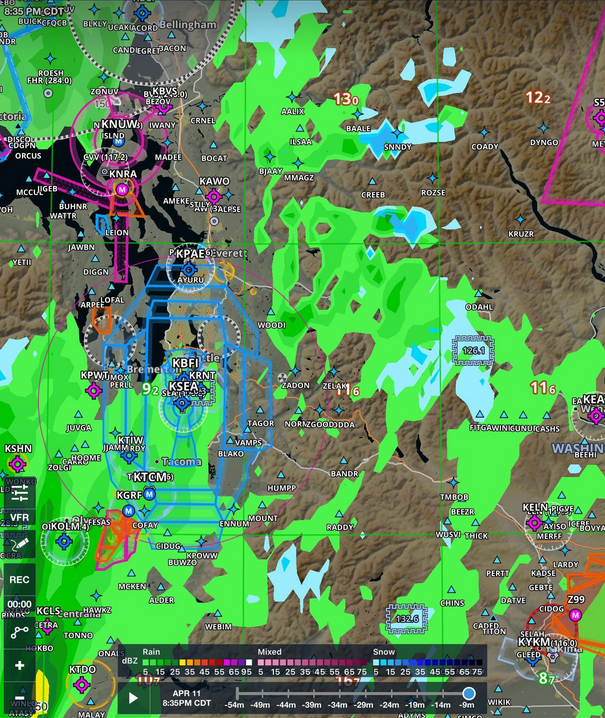
Figure 5 – Composite
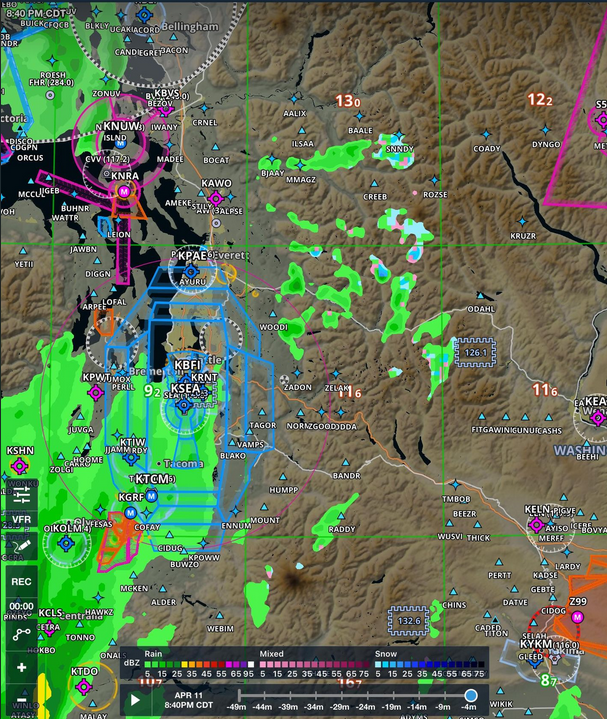
Figure 6 – Lowest tilt radar
With that knowledge, let’s discuss radar, flight planning, and the best way to use this data.
Remember there isn’t one single source of data that’s best for every flight and every situation. Weather is a process, not a static event. Weather is three-dimensional and always changing, sometimes rapidly. Even the best weather data can only give a snapshot of a single point in time of weather. Pilots should be using these pieces of data to build a picture of the weather process, how it has changed, and how it will change. For clear sky, short VMC hops, maybe a glance at METARs, NOTAMs, and TAFs is sufficient, but for longer trips, pilots should use every piece of weather data so they can get the most complete picture.
This is especially true for trips with active weather. It’s important to use all the tools in the shop. METARs, TAFs, satellite cloud data, lightning data, and BOTH radar layers can all tell you various pieces of the weather process. When appropriate, be sure to take a look at SIGMETs and PIREPs along your route. In the cockpit, remember that SiriusXM and ADS-B delivered radar data is lower-resolution than what you get via cellular or wifi on the ground. The ADS-B radar data is only composite radar data, while SiriusXM offers a lower-resolution “Base” or lowest tilt layer.
While controllers along your route have much better radar data than in years past, even that is limited, and your radar data in the cockpit might be better.
So, back to our question:
Which radar data is better for a pilot to use?
A) Radar (Composite)
B) Radar (Lowest Tilt)
C) Both A and B
It’s almost a trick question. C) is the correct answer. Use them both; know where the data for each comes from as well as the strengths and weaknesses of each radar data type. Above all, be safe up there.
Reach out anytime, I’d love to hear from you.
@jamesaydelott (Twitter/X)
@jamesaydelottwx (Instagram)
jaydelott@fox23.com (email)
For more information:
https://www.noaa.gov/jetstream/vcp_max