When flying on a bumpy day, you’ll have heard other pilots checking in with ATC to ask for reports of smoother altitudes from others on frequency. Avoiding turbulence is not always that simple though – even for the most experienced pilots. Planning a bump-free flight is a challenging and frequently unreliable process.
Typically, pilots rely on a combination of Pilot Reports (PIREPs), computer-generated forecast models, and winds aloft forecasts to anticipate air conditions. These methods each have limitations and using all three together doesn’t guarantee success either.
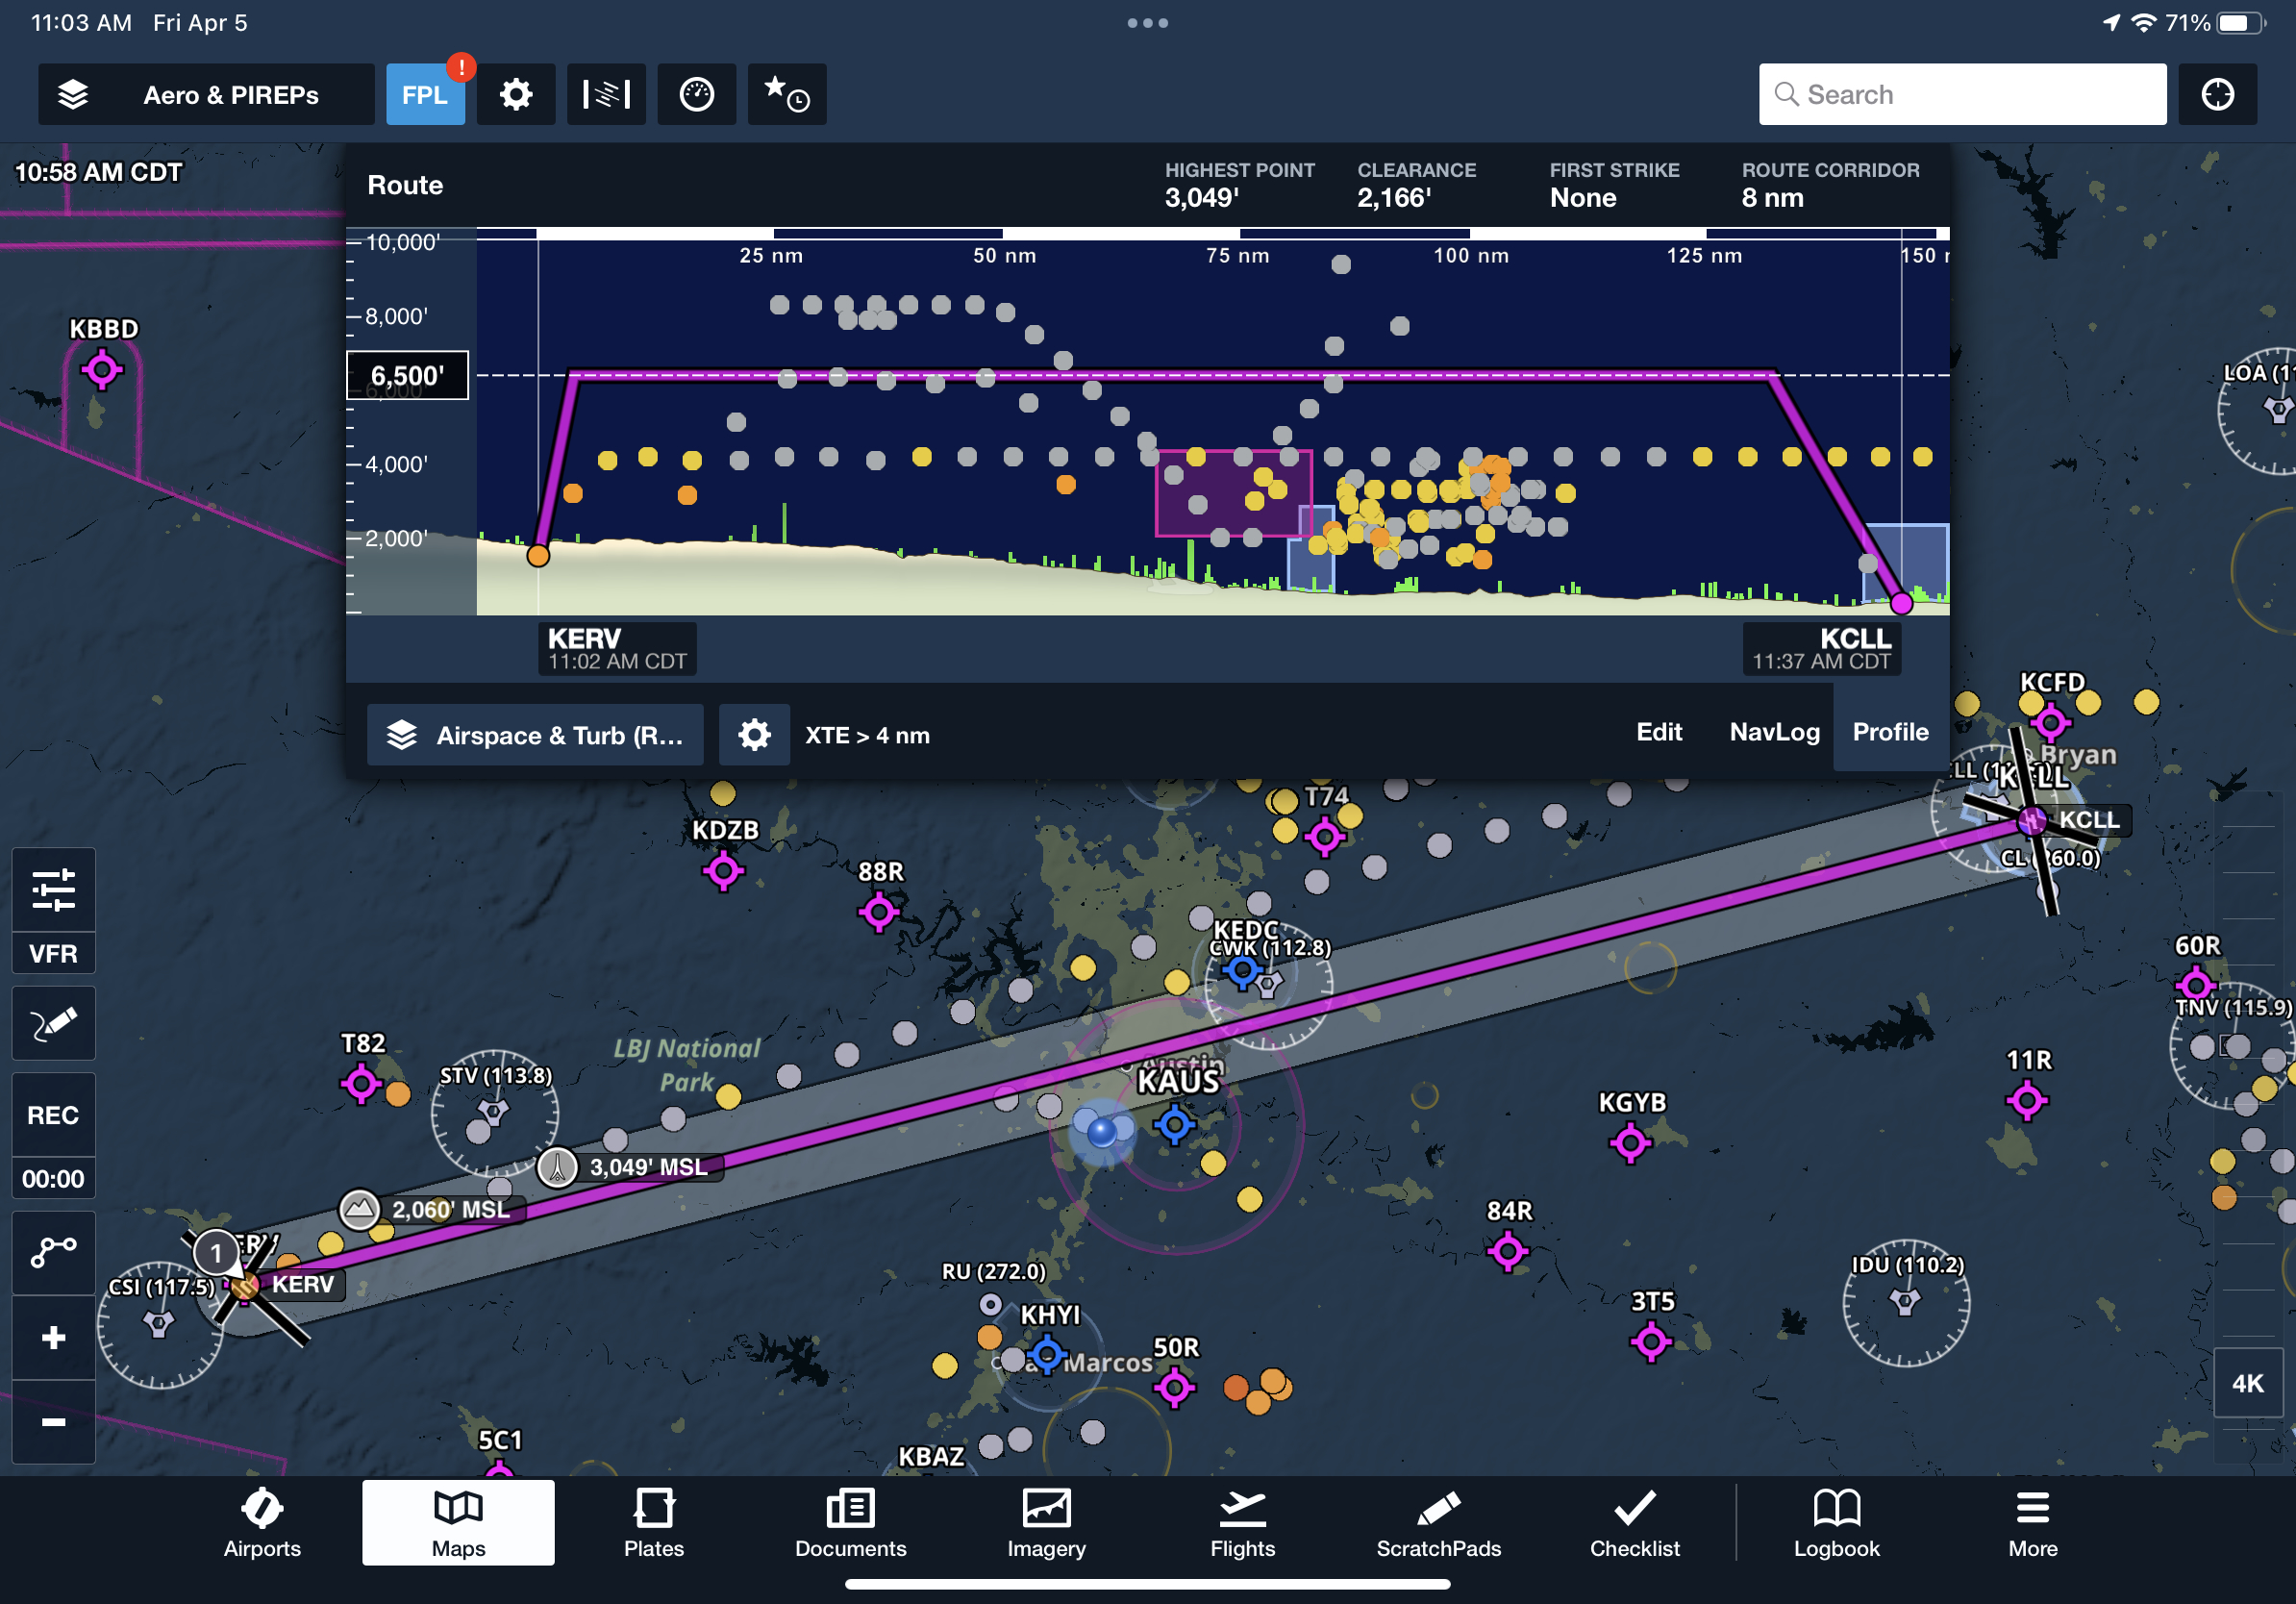
ForeFlight’s latest innovation, Reported Turbulence map layer can help. It’ll transform how you find smooth air with automated turbulence reports directly in your ForeFlight Mobile app

Reported Turbulence in ForeFlight Mobile
With the latest update to ForeFlight Mobile (16.4, April 2024), users can now access a new map layer showing reports of actual inflight turbulence (or lack thereof). Two different subscription add-ons allow you to view these turbulence reports at different altitude ranges: Reported Turbulence (Low) provides access to turbulence reports up to 14,000 feet, and Reported Turbulence (All) grants access to reports at all altitudes. Keep reading to learn how you can get these add-ons at a discount or even free of charge.
Developed in-house, the new layer displays automated ride reports from aircraft equipped with ForeFlight’s Sentry or Sentry Plus. Tens of thousands of these portable ADS-B receivers collect inflight sensor data to give you a reliable picture of where turbulence is or isn’t present. Unlike PIREPS, our turbulence reports require no human action to submit data, and each report reflects actual, measured conditions – rather than a forecast of possible future conditions. Plus, this new capability allows pilots to actually see where the air is smooth, not just where there’s turbulence – a data point often omitted with PIREPs.

Data-driven Turbulence Reports
So how do ForeFlight’s automated reports work? Our Sentry and Sentry Plus receivers are equipped with several sensors that measure turbulence in addition to their other functions, using a unique algorithm developed in-house. The sensors detect, classify, and automatically save ride-quality reports, circumventing the subjective nature of manually submitting PIREPs. Reports are saved every two minutes, giving a high degree of accuracy.
The algorithm takes the data from Sentry’s accelerometers, barometer, ADS-B antennas, GPS data and other input data. It’s carefully filtered to exclude any unreliable or erroneous information and the results give a detailed ride quality map layer.
Turbulence reports are classified into intensity categories: Smooth, Light, Moderate, Severe, and Extreme. They’re then uploaded to ForeFlight Mobile as soon as an internet connection is established after or even during a flight.
How Smooth is Smooth?
How to classify our turbulence reports in the most practical way was an interesting challenge. Can you quantify ‘smooth’?
Turbulence exists on a spectrum, not just as a discrete set of values. Air can be as smooth as glass, or as turbulent as tennis shoes in a dryer. Or anywhere in between. Our brains prefer discrete classifications, as that’s what we’re used to. Consider precipitation radars, which return dbZ values for intensity. Most applications display those dbZ values as individual colors such as green, yellow, red and fuchsia. Yet, we know that the precise reality can of course be somewhere between two colors.
So it is with our turbulence report classifications. The point at which ‘Smooth’ tips into ‘Light’ may be fixed in terms of data points, but will still vary from person to person.
We landed on a conservative definition of ‘smooth’ in our Reported Turbulence layer. Our definition is one that virtually everyone, in any kind of aircraft, would agree is pretty smooth. So you can be sure that the ‘Smooth’ air reports you see in ForeFlight really do represent smooth air.
For ‘Light’ to ‘Moderate’ turbulence, we chose to position the boundary closer to the moderate side, so pilots can more easily distinguish between light turbulence and a less comfortable ride caused by moderate bumps.
Ride Quality and Intensity Changes
It’s also worth noting that ride quality isn’t a constant, and neither is the intensity of turbulence over the two minutes of flight time represented by each individual report. So to make the reports as useful as possible, we categorize each turbulence report based on the worst ride quality experienced during that time.
For example, if the air was perfectly still for the majority of the two-minute report period but you encountered one moderate hit of turbulence, the resulting turbulence report will be classified as ‘Moderate’. Users can therefore interpret every ‘Moderate’ report as at worst, moderate, and safely assume that the ride is moderate or better.

Pioneering Innovation in Turbulence Reporting
Being able to use data from tens of thousands of Sentry devices to deliver valuable new information to pilots represents a significant leap forward in aviation safety and product innovation.
Years of meticulous algorithm development, classification, testing, and analysis of tens of millions of ride quality reports from tens of thousands of aircraft underpin this new turbulence report feature. It’s a testament to our commitment to developing new technologies that enhance flight safety, and we’re confident this will pave the way for further breakthroughs in this area.
Working Together for More Comfortable Flying
This valuable new feature is powered by community. Its capability depends on pilots flying with Sentry and Sentry Plus devices contributing data to power the map layer, providing valuable turbulence data for the benefit of other users. So we want to make it as easy as possible to benefit from, use, and contribute to. That’s why the new Turbulence Reporting (Low) map layer is available free of charge to individual customers with Pro Plus and Performance Plus subscriptions who register their Sentry’s serial number. ForeFlight Business customers can contact Sales for pricing and more information on how to get started with Reported Turbulence.
Register Your Sentry
Enter your Sentry or Sentry Plus’s serial number at the bottom of foreflight.com/account to access Reported Turbulence with a Pro Plus subscription plan or above. Doing so will also grant you 50% off the Reported Turbulence (All) add-on to unlock turbulence reports above 14,000 feet. You’ll receive an email after registering your Sentry with a link to buy this add-on with the discount applied should you need it.
Tips & Tricks
Here are some patterns to look for using the Reported Turbulence layer that could help you find smoother air for your next flight.
Altitude
Air tends to be smoother at higher altitudes. In fact, our data suggests that ~93% of all reports are smooth above FL180, but at 10,000 feet only ~40% of reports are smooth. On most days, you’ll see lots of light turbulence reports down at lower altitudes near the ground. If you open Profile View and turn on the “Reported Turbulence” layer (available alongside other weather layers with Performance Plus subscription plans), you might notice that reports tend to become significantly smoother above a specific altitude. Planning to cruise at or above that altitude should help keep you in smooth air.

Flight Paths
Plan smoother and safer flights by seeing where other pilots are encountering smooth air or turbulence. The flight paths of individual aircraft are often clearly visible in the Reported Turbulence data, and in some cases you can even see where a pilot initiated an altitude change after encountering significant turbulence.

Planning
The top down map view is useful for days when you may not be able to deviate laterally or vertically around turbulence, and instead you need to accept the reality that confronts you. The top down map layer will help you determine when, where, and for how long you’ll be in turbulence.
Plan Smoother Rides
ForeFlight turbulence reporting will transform how you find smooth air with near real-time, automated turbulence reports directly in your ForeFlight Mobile app.
We hope you find this new capability as exciting as we do. You’ll be able to see where pilots are experiencing turbulence to plan a more comfortable, safer flight using data from tens of thousands of Sentry devices, guiding you to calm and clear skies.
We’re thrilled about the future innovations this data will enable, and look forward to enhancing your flying experience even further.